2025 Gulf of Maine Temperature Report
Reports | Mar 2, 2026
Over the past decade, our scientists have led a body of research that highlights temperatures in the Gulf of Maine. To keep you informed, we share seasonal and annual updates about conditions in our region.
The 2025 Gulf of Maine Temperature Report summarizes recent temperature changes in the region through three perspectives: facts, drivers, and impacts. This year and moving forward, we focus on the Gulf of Maine Ecological Production Unit, which has a clearly defined boundary, rather than a simple “box” used in previous reports that partly included slope waters. We also use the higher-resolution GLORYS12v1 reanalysis and examine both surface and bottom temperatures to provide a more complete picture of regional warming.
Highlights from the Year
- In 2025, the Gulf of Maine experienced its 15th warmest sea surface temperature (SST) year on record (51.3°F; +0.74°F above normal).
- Bottom temperature (BT) ranked as the 11th coolest year on record (-0.38°F below normal), marking a notable surface-bottom contrast.
- Surface warming was strongest during late summer and early fall, with three marine heatwave events between July and October, while bottom temperatures remained relatively cool and did not reach extreme thresholds.
- Long-term trends continue to show rapid warming in the Gulf of Maine, nearly triple the global ocean average at the surface, with the strongest warming occurring during the stratified summer months.
1. Facts: What is going on?
1.1 Annual warming trends in the Gulf of Maine
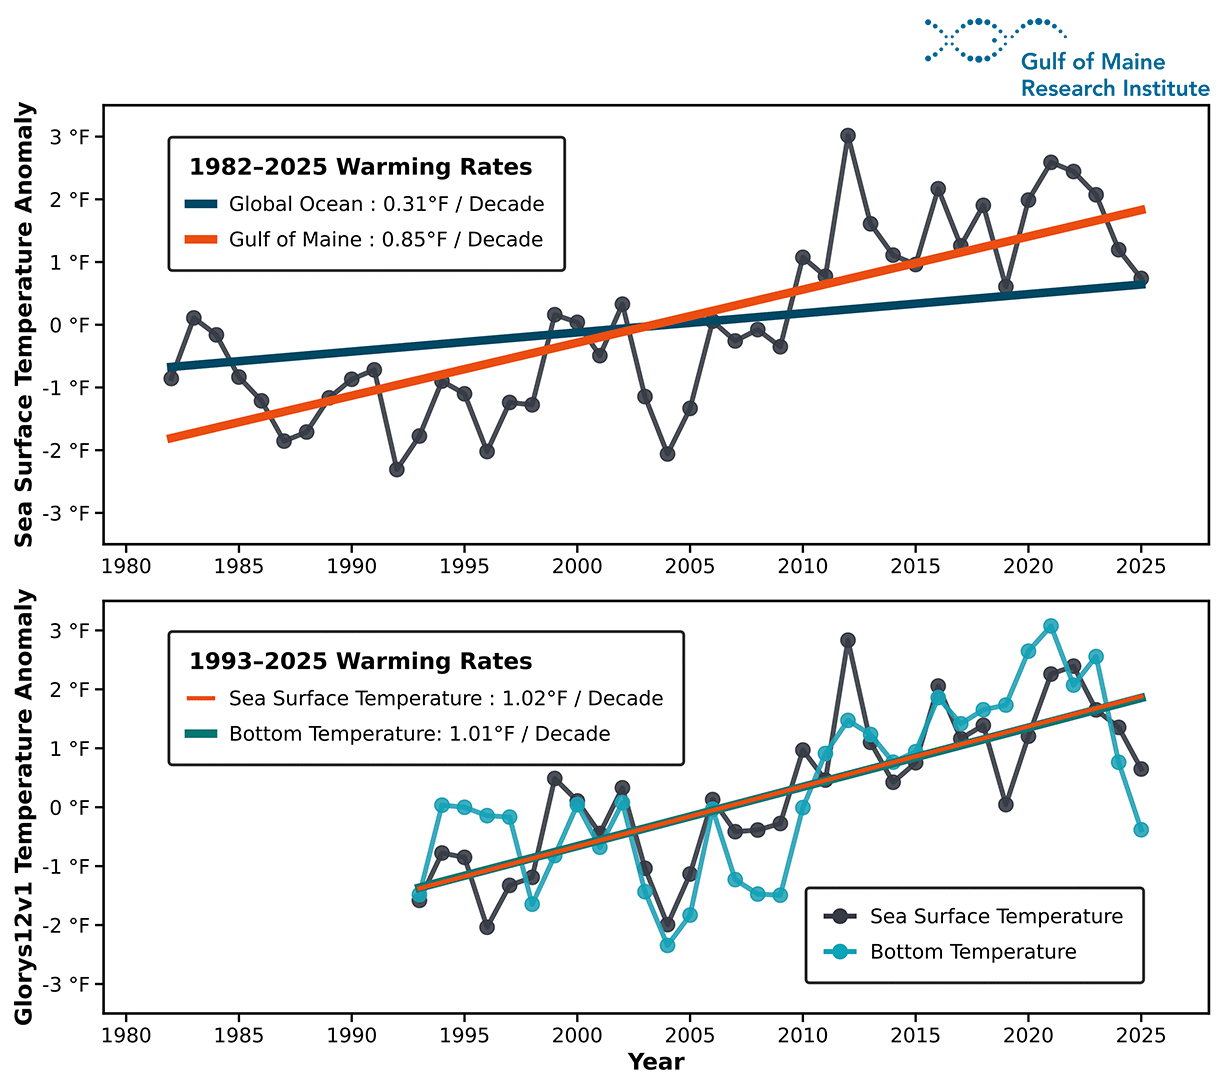
Average annual SSTs in the Gulf of Maine have been warming at a rate of 0.84°F per decade from 1982 to 2025, nearly triple the global ocean average of 0.31°F per decade, based on the NOAA OISST dataset (Figure 1a). The higher-resolution GLORYS12v1 reanalysis shows nearly identical warming trends (approximately 1°F per decade) in both SST and BT in the Gulf of Maine from 1993 to 2025 (Figure 1b). Over the same period, the OISST-derived SST trend for the Gulf of Maine is slightly higher (1.19°F per decade), but overall both datasets consistently indicate rapid and coherent warming in recent decades.
1.2 How unusual was this year?
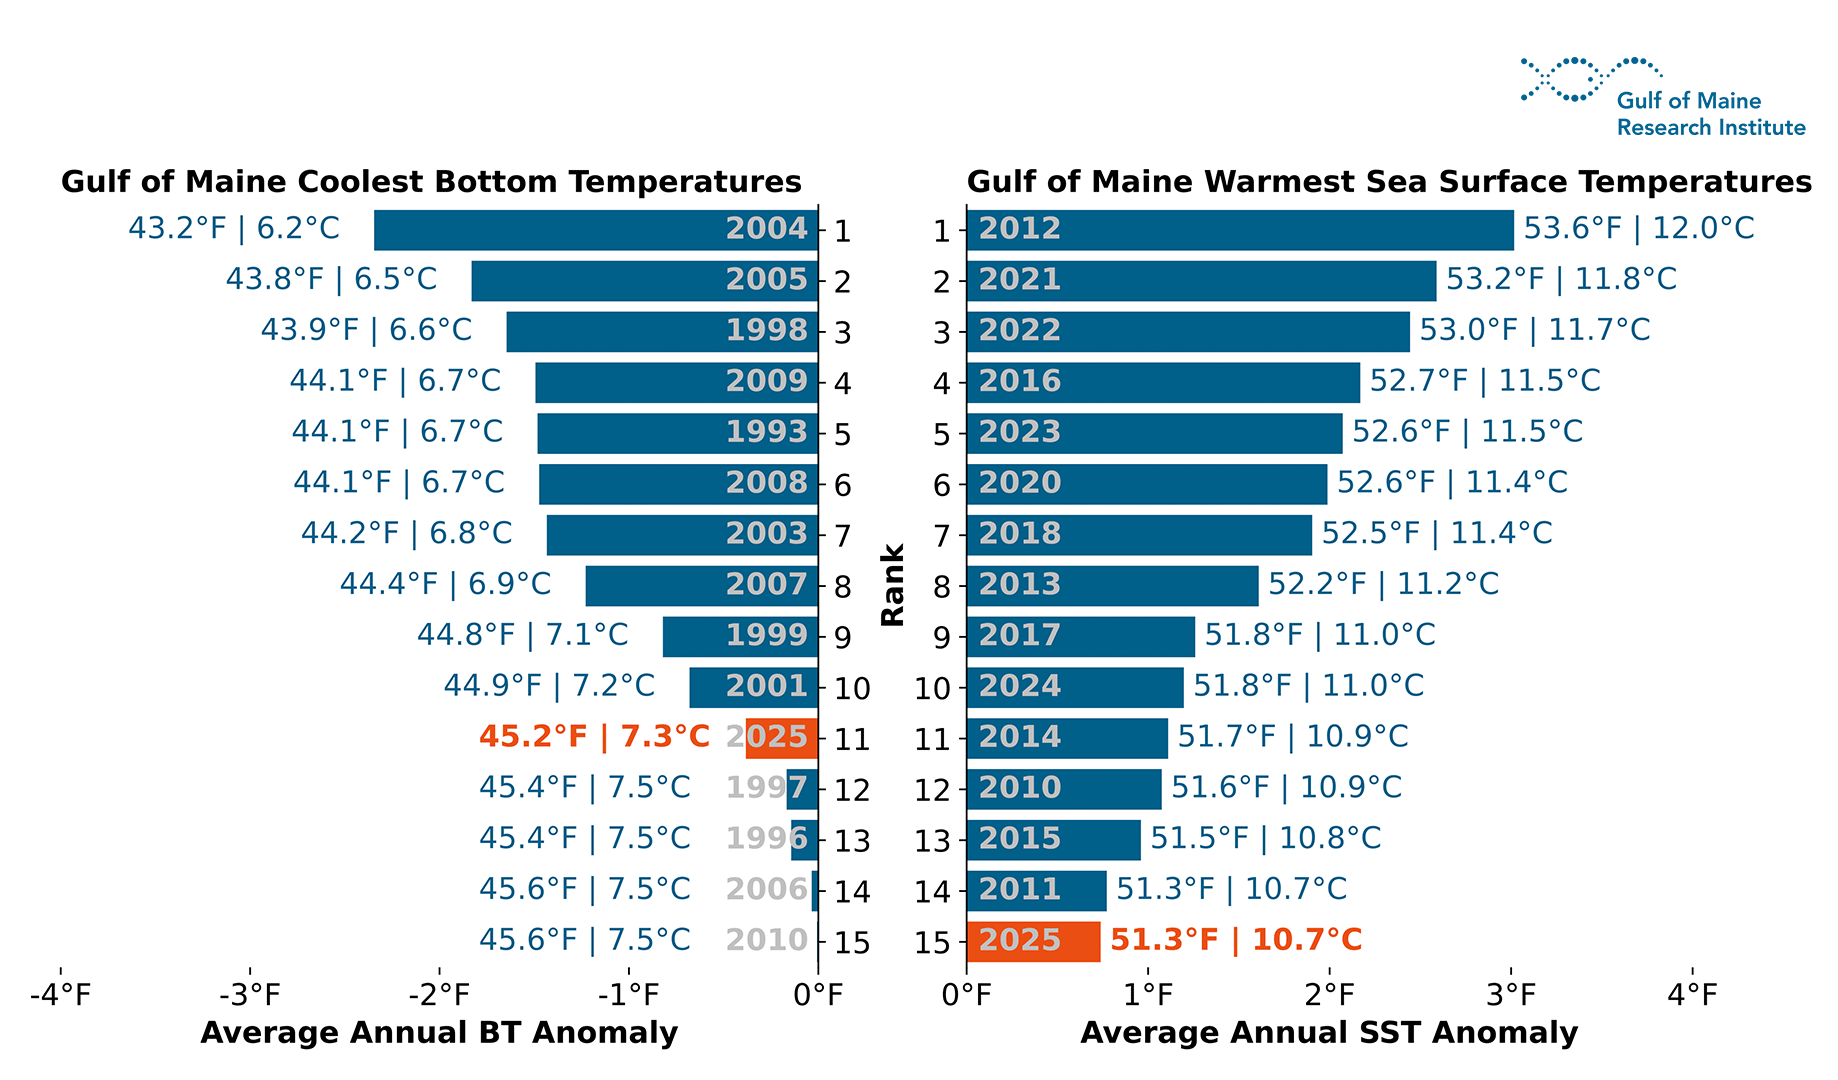
The annual average Gulf of Maine SST in 2025 was 51.3°F, which was 0.74°F above the 1991 – 2020 climatology. This places the year 2025 as the 15th warmest year on record (Figure 2, right panel) and on the lower end of the above-average SST years observed since 2010. The annual average BT in 2025 was 45.2°F, 0.38°F below the 1991 – 2020 climatology. This ranks the year 2025 as the 11th coolest year on record (Figure 2, left panel) and toward the lower end of the below-average BT years observed since 2011.
All above-average surface warming years have occurred since 2010, whereas nearly all below-average bottom cooling years occurred prior to 2010, except for 2025. The year 2025 marks the second occurrence since 2010 of simultaneous above-average surface warming and below-average bottom cooling.
Note: Because this report uses the Gulf of Maine Ecological Production Unit (EPU) boundary rather than the broader “box” region used in earlier GMRI warming updates, the ranking of the warmest year differs from previous publications. Earlier analyses included portions of adjacent slope waters, which have warmed more rapidly in recent decades and elevated the regional average in some years. As a result, differences in warmest-year rankings reflect the updated spatial domain rather than any change or error in the underlying data.
1.3 Seasonal and monthly conditions
The seasonal (quarterly) time series of Gulf of Maine SST and BT anomalies relative to the 1991 – 2020 climatology indicate consistent long-term warming in both surface and bottom waters, with amplified warming during the stratified months. Across all seasons, both SST and BT exhibit positive long-term trends, though the magnitude of warming varies seasonally.
Surface warming is strongest during July-September (1.35°F per decade), followed by April – June (1.10°F per decade) and October – December (0.81°F per decade), and is weakest in January – March (0.46°F per decade).
Bottom temperature trends are generally comparable to, though slightly weaker than, SST trends. The largest bottom warming also occurs in July – September (1.08°F per decade) and April – June (1.13°F per decade), with weaker trends in October – December (0.88°F per decade) and January – March (0.93°F/ per decade). The time series further highlights pronounced interannual variability superimposed on these upward trends, particularly during spring and summer.
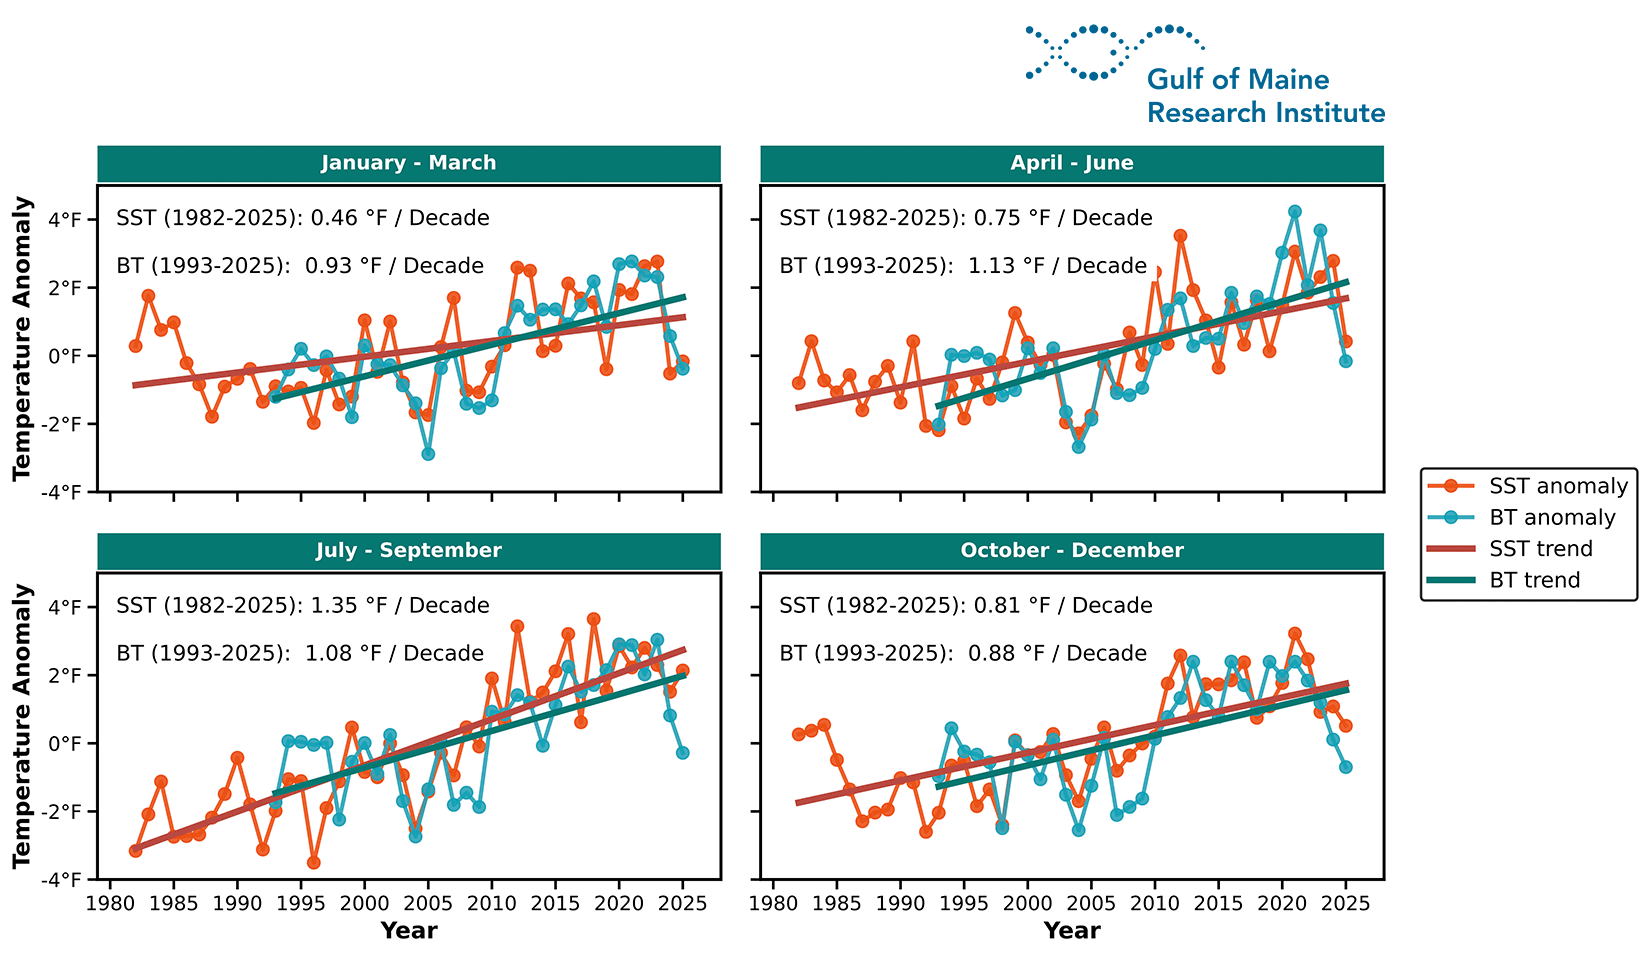
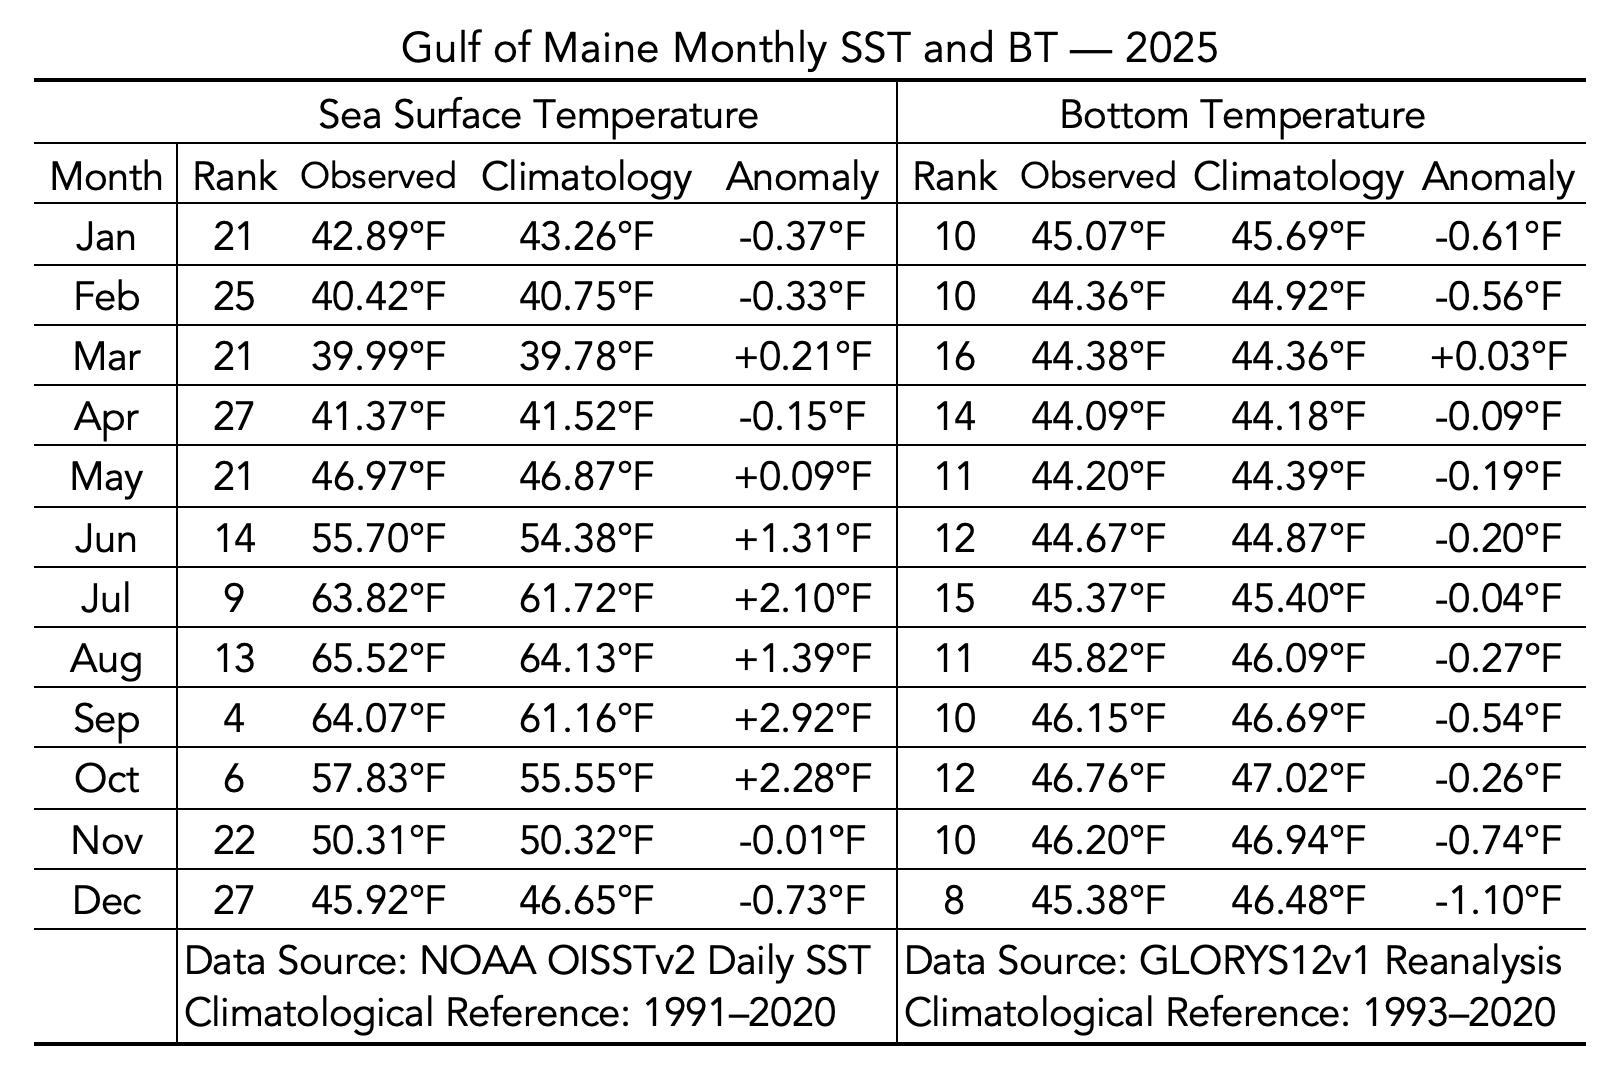
Table 1 highlights pronounced seasonal contrasts in Gulf of Maine surface and bottom temperature conditions during 2025.
Surface temperatures, ranked from warmest to coolest, were generally above the 1991 – 2020 climatology for much of the year, with September and October ranking as the fourth and sixth warmest on record, respectively.
In contrast, bottom temperatures, ranked from coolest to warmest, indicate that most months in 2025 were within the cooler end of the historical record relative to the 1993 – 2020 climatology. The anomaly values show that surface warming was most pronounced during the stratified summer months (June – October), while bottom temperature departures were relatively weaker, with the largest negative anomaly occurring in December.
Overall, the table reinforces the vertical contrast in 2025, characterized by above-average surface warmth alongside relatively cool bottom conditions, particularly during the stratified months (May – October).
1.4 Daily temperature variability and marine heatwaves in the Gulf of Maine
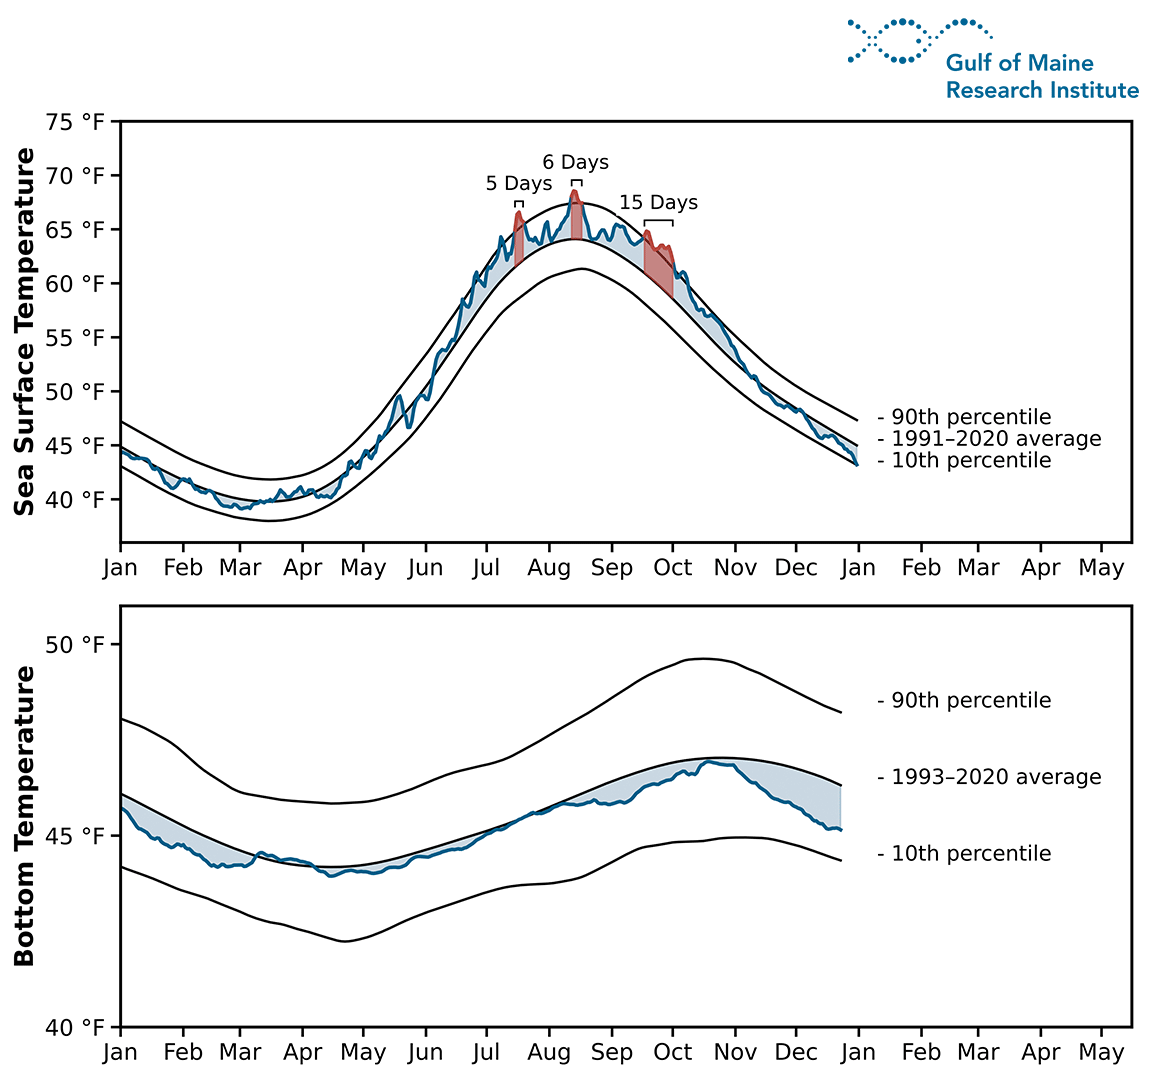
Figure 4 shows daily SST and BT time series compared to their climatology, along with the 90th and 10th percentile thresholds commonly used to identify extreme events (e.g. heatwaves and cold spells). Marine heatwave (MHW) events are defined as periods of five or more consecutive days during which observed temperatures exceed the smoothed 90th percentile of the long-term daily distribution. Cold spells are defined as periods of at least five consecutive days during which temperature falls below the smoothed 10th percentile. Gaps of up to two days above or below the respective threshold are merged into a single event.
During 2025, Gulf of Maine SST anomalies ranged from -1.88°F below to +4.77°F above the 1991 – 2020 climatology. Daily SSTs exceeded the climatological mean for much of the stratified season, with three distinct marine heatwave events identified in late summer and early fall. These events occurred on July 15 – 19, August 12 – 17, and September 17 – October 1, lasting approximately 5, 6, and 15 days, respectively, indicating short but intense periods of anomalous surface warming.
In contrast, Gulf of Maine bottom temperatures remained closer to the climatological mean throughout the year, did not exceed either the 10th or 90th percentiles, and exhibited mostly negative and relatively modest anomalies. The weaker bottom response compared to the surface further highlights the vertical contrast in 2025, with enhanced surface warming occurring alongside relatively muted bottom temperature variability. Overall, marine heatwave conditions in 2025 were primarily located at the surface, particularly during the stratified summer months, with limited penetration of anomalous warmth to depth.
1.5 Heatmap of Temperature Anomalies and Heatwave Events
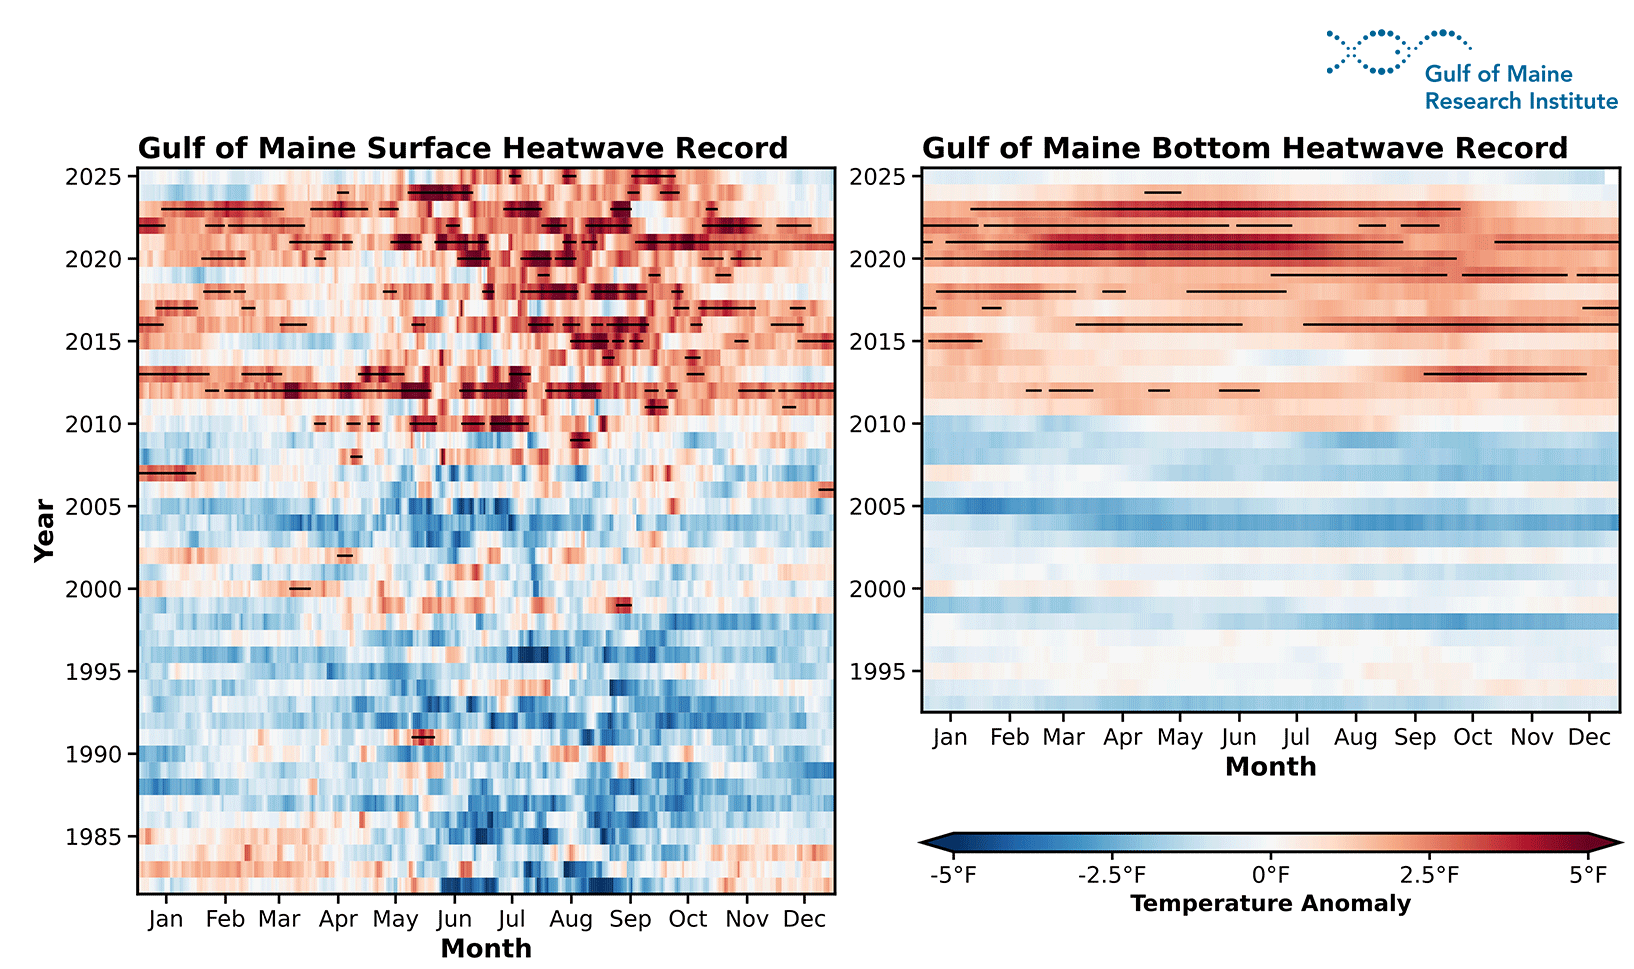
Figure 5 illustrates the evolution of Gulf of Maine surface and bottom temperature anomalies since the 1980s and 1990s, respectively, with MHW events highlighted by black bars. The surface heatmap (left panel) shows a marked shift toward predominantly positive SST anomalies after 2010, with increasingly frequent and intense warm events during the summer and early fall months. Surface MHWs become more common and persistent in the latter half of the record, with multiple years exhibiting repeated late-summer events.
In contrast, the bottom temperature heatmap (right panel) displays muted variability overall. While warm bottom events are evident and sometimes persist longer than surface events, their magnitude is generally smaller. The bottom record also shows a similar post-2010 intensification of warm extremes as seen at the surface. Notably, 2025 is the first year since 2015 without a bottom MHW event. This pattern reinforces the vertical contrast highlighted in previous figures.
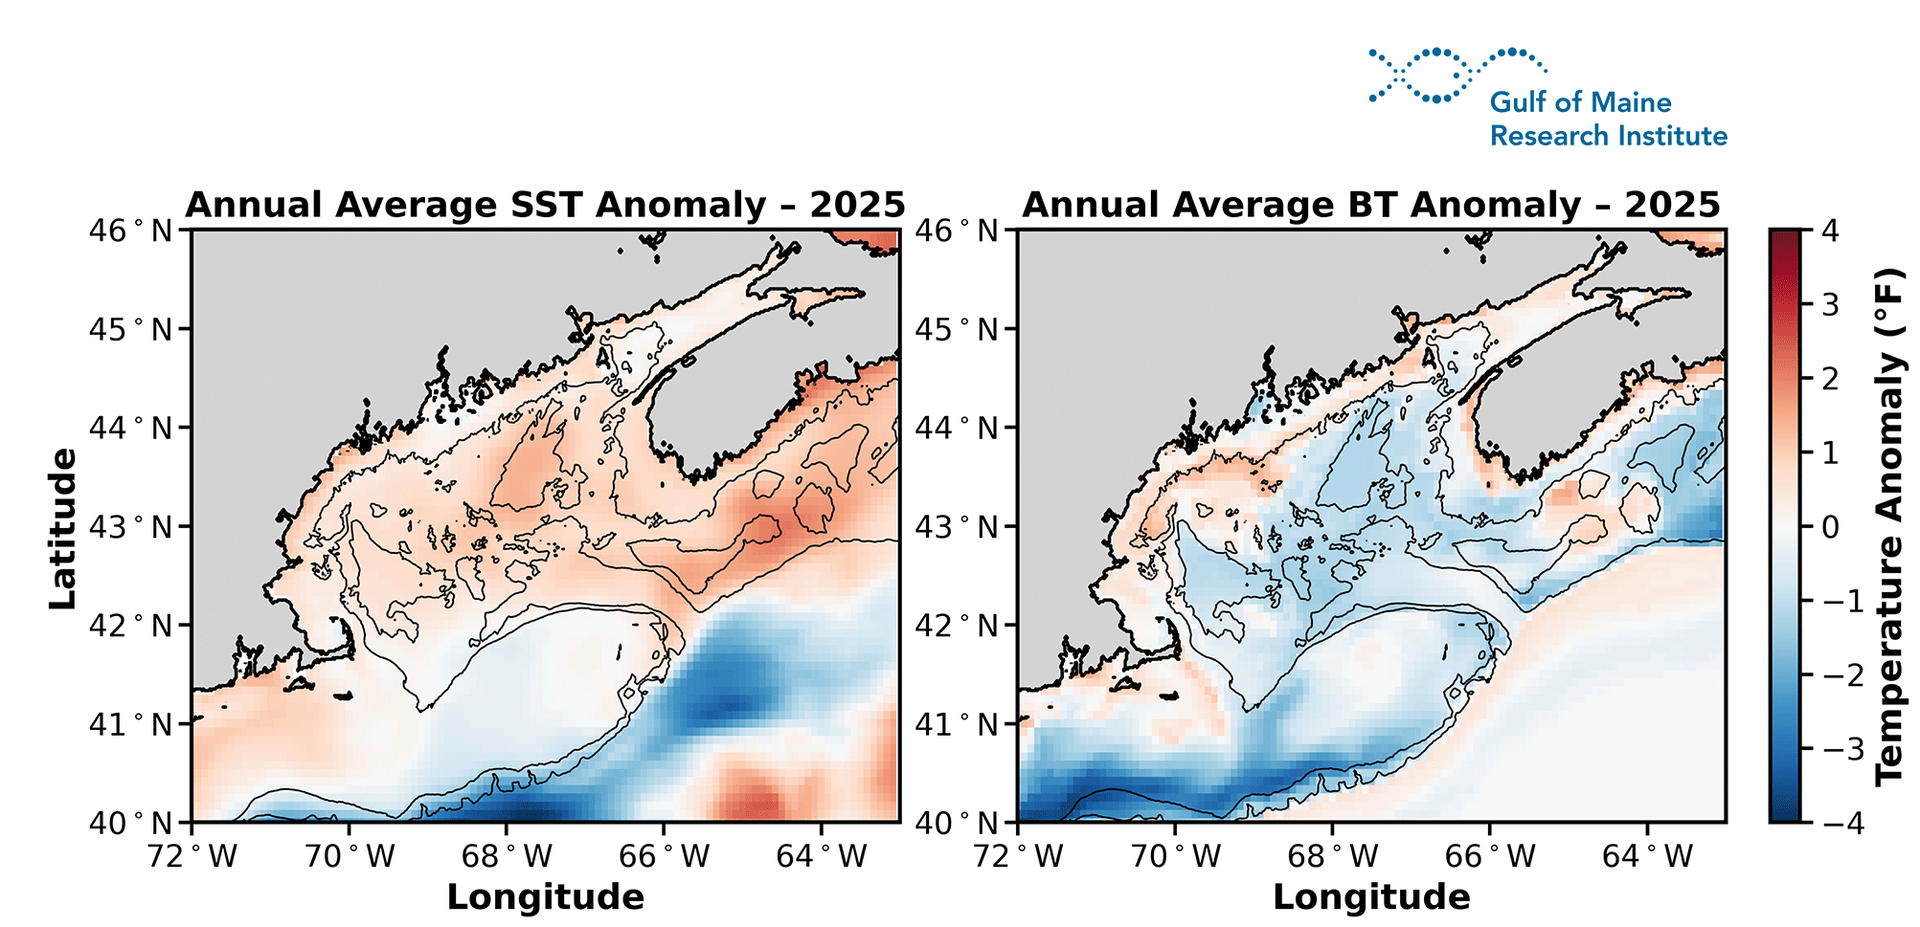
1.6 Annual Temperature Anomaly Map
In 2025, surface warming was widespread across much of the interior Gulf of Maine, with the strongest positive SST anomalies concentrated over the central and eastern shelf. In contrast, bottom temperatures exhibited a different spatial pattern, with below-average conditions across much of the deeper Gulf and along portions of the southwestern shelf. This surface-bottom contrast highlights the vertical decoupling observed in 2025, where atmospheric-driven surface warming did not uniformly penetrate to depth. The spatial structure also suggests differing influences of shelf processes and slope-water interactions on bottom temperature variability.
2. Drivers: Why is it happening?
2.1 Atmospheric forcing vs. Ocean-driven changes
Changes in ocean temperature are closely linked to exchanges of heat between the ocean and atmosphere. The ocean gains heat through processes such as solar radiation and warm air advection and loses heat through evaporation and turbulent fluxes. Persistent high pressure, reduced winds, shifts in the jet stream, and large-scale climate modes can all modulate these exchanges.
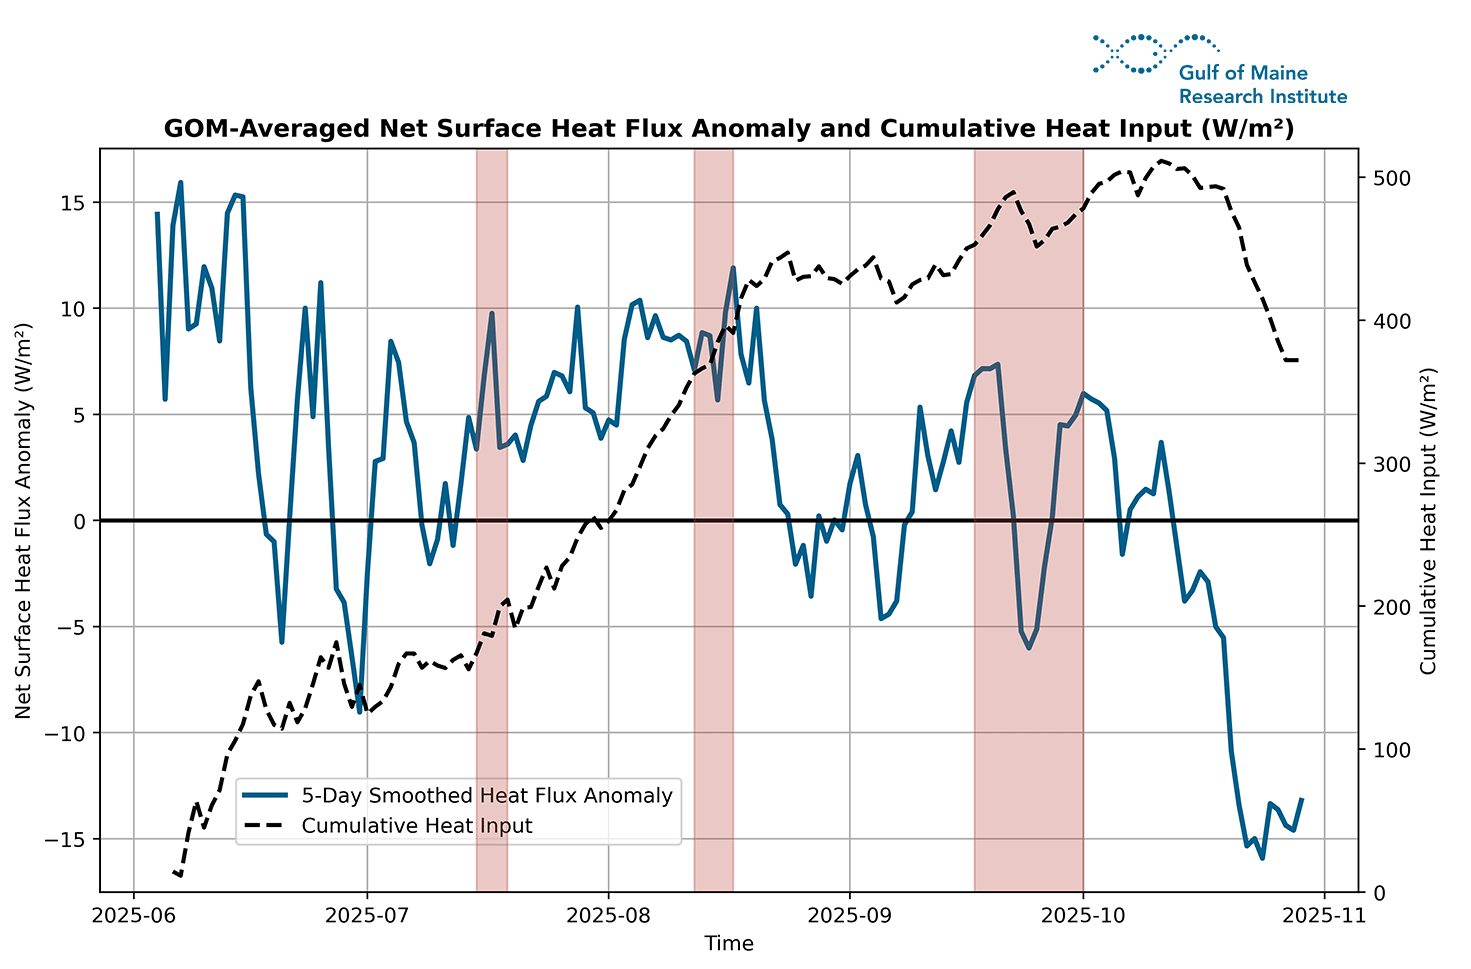
To evaluate atmospheric influence during 2025, we examined the smoothed net air-sea heat flux anomaly (Qnet) and the cumulative heat input over the Gulf of Maine (Figure 7). Positive Qnet anomalies indicate enhanced heat transfer from the atmosphere into the ocean, while the cumulative curve shows how that energy builds over time.
The July MHW event (July 15 – 19) shows clear evidence of atmospheric preconditioning. The smoothed heat flux anomaly exhibits sustained positive values leading into the onset of the heatwave, and the cumulative heat input rises steadily through early to mid-July. This persistent atmospheric heat input likely primed the surface ocean, increasing upper-ocean heat content prior to the event. The steady increase in cumulative heat is particularly compelling, indicating that excess atmospheric energy was being stored in the ocean before temperatures crossed marine heatwave thresholds. In this case, atmospheric forcing appears to have played a direct and important role in triggering the event.
The August event (Aug 12 – 17) presents a weaker atmospheric signal. The smoothed heat flux anomaly is modestly positive beforehand, but not as sustained as in July. The cumulative heat curve continues to rise, though more gradually. This pattern is consistent with background seasonal heat accumulation rather than a distinct atmospheric forcing episode. By mid-summer, the upper ocean is already warm, and relatively small perturbations can push temperatures above extreme thresholds. Thus, the August event appears to reflect accumulated summer heat combined with internal ocean variability, rather than strong atmospheric preconditioning.
The September – October event (Sep 17 – Oct 1) shows the clearest evidence of limited atmospheric contribution. The cumulative heat input is already elevated prior to the event and begins to level off around the heatwave window. Meanwhile, the smoothed Qnet anomaly is mixed, with notable negative excursions during the event period. These negative flux anomalies indicate periods when the atmosphere was extracting heat from the ocean, suggesting that atmospheric conditions may have dampened rather than reinforced the heatwave toward its end. This strengthens the interpretation that the late-season event was largely sustained by internal ocean processes rather than active atmospheric forcing.
Taken together, the three events illustrate that atmospheric influence varied across the 2025 marine heatwaves. The July event shows strong evidence of atmospheric preconditioning, the August event reflects more gradual seasonal heat buildup, and the September event appears primarily ocean-driven with limited or even opposing atmospheric influence.
2.2 Why did bottom temperatures respond differently compared to surface temperatures?
While atmospheric heat flux largely drives short-term surface warming, bottom temperature variability in the Gulf of Maine is strongly influenced by changes in ocean circulation and source waters, particularly the position and behavior of the Gulf Stream.
The Gulf Stream is a major western boundary current that transports warm, salty subtropical water northward along the U.S. East Coast. Shifts in its north-south position alter the balance between warm slope water of subtropical origin and cooler, fresher waters derived from the Labrador Current. These slope waters interact with the continental shelf and can enter the Gulf of Maine through deep channels, influencing bottom temperature and water mass properties.
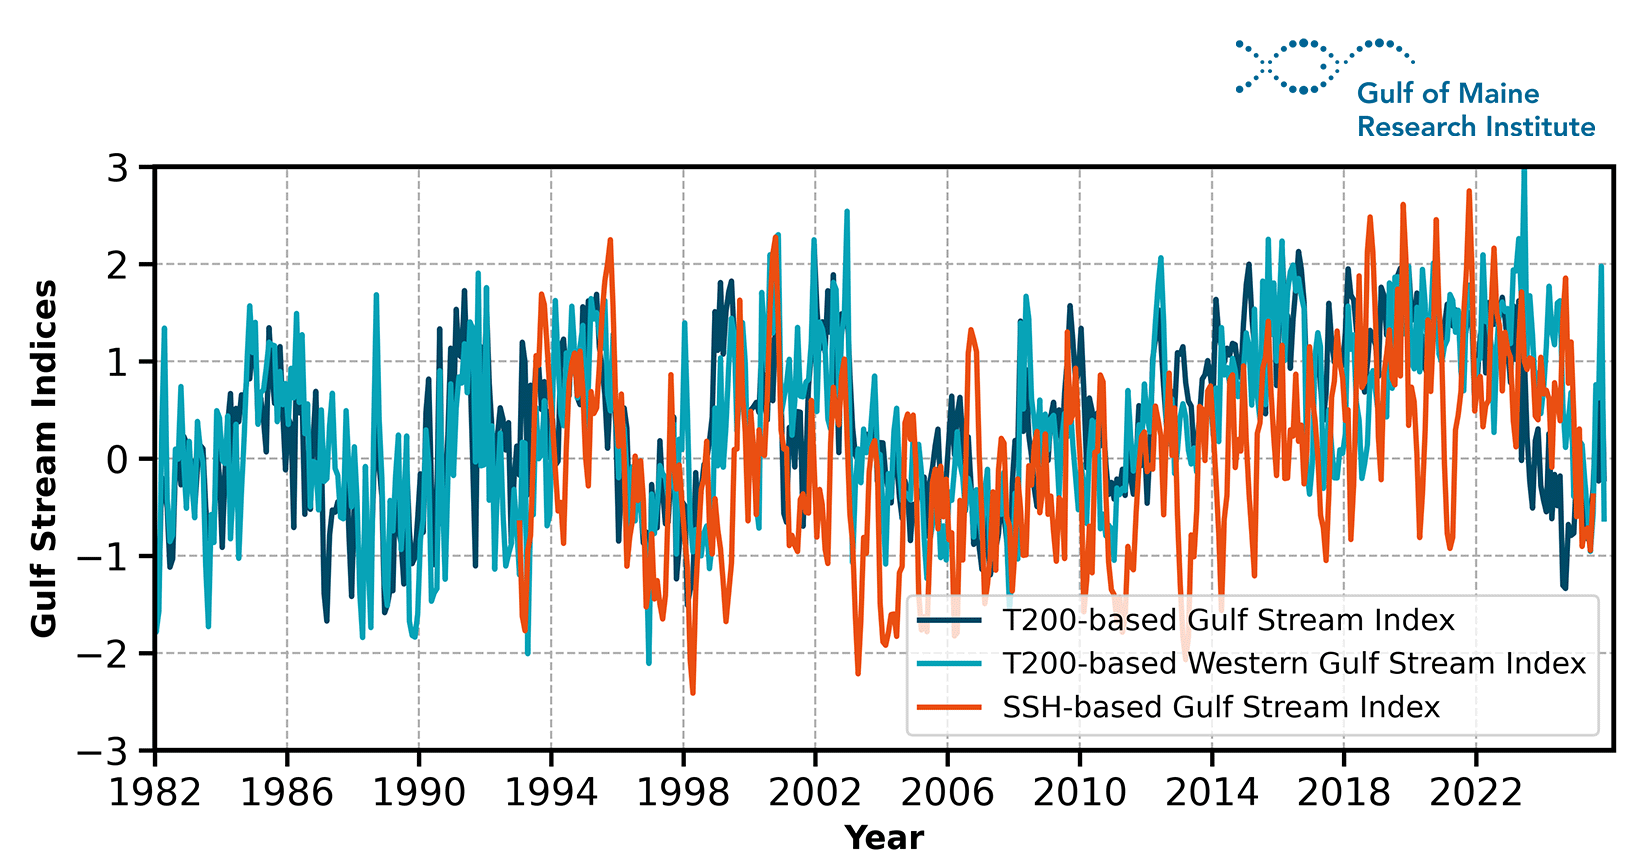
Figure 8 shows monthly Gulf Stream indices derived from subsurface temperature at 200 m (T200-based indices) since 1982 and satellite sea surface height (SSH) since 1993. These indices track north-south displacements of the current. From the mid-2010s through the early 2020s, the Gulf Stream tended to occupy a more northerly position, consistent with enhanced influence of warmer, saltier slope waters along the Northeast U.S. shelf. In 2025, however, the indices suggest more variable and occasionally southward shifts, indicating less persistent northward displacement compared to previous years.
These circulation changes matter because bottom warming in the Gulf of Maine often reflects the characteristics of incoming slope waters rather than direct atmospheric forcing. When the Gulf Stream shifts northward, it can enhance the presence of warm, salty Atlantic waters near the shelf break, increasing the likelihood of warm water intrusions into the Gulf and raising bottom temperatures. Conversely, a more southward or variable Gulf Stream position can favor cooler source waters, contributing to muted or even negative bottom temperature anomalies.
The vertical contrast observed in 2025 (above-average surface warmth alongside relatively cool bottom conditions) illustrates this decoupling. Surface temperatures responded strongly to atmospheric forcing and seasonal stratification, including late-summer marine heatwaves. In contrast, bottom temperatures remained closer to climatology, consistent with limited influence of anomalously warm slope water during the year.
3. Impacts: Why does it matter?
The warming patterns documented in this report have real-world consequences for marine ecosystems, fisheries, and coastal communities. Rapid surface warming, widespread marine heatwave events, and persistent vertical temperature contrasts influence distributions of species and affect habitat conditions, with implications already visible in long-term monitoring programs like the Casco Bay Ecosystem Monitoring Survey. In Casco Bay, nearshore fish catch indices for foundational species such as Atlantic herring, Atlantic silverside, and green crab have collapsed to time-series lows, while community structure is shifting with the appearance of typically southern species like spot - an indicator of changing thermal habitat conditions. These biological responses reflect broader ecosystem changes documented in the Gulf of Maine, where warming waters are associated with declines in cold-adapted species and altered recruitment patterns that affect fisheries productivity and economic viability.
For coastal communities and the seafood economy, these shifts complicate management and planning, as traditional fishery targets, seasonal cycles, and habitat suitability evolve in response to climate-driven changes in ocean temperature. This underscores the need for climate-informed fisheries science, adaptive management strategies, and sustained ecosystem monitoring to support resilient ecosystems and the coastal communities that depend on them.
4. Data sources, methods, and reproducibility
This report integrates satellite observations and ocean reanalysis products to characterize surface and bottom temperature variability in the Gulf of Maine. All analyses are reproducible using publicly available datasets and clearly defined methodological choices described below.
Data Sources
NOAA OISST v2 (Optimum Interpolation Sea Surface Temperature)
We use the NOAA OISST v2 daily dataset (0.25° spatial resolution), available from 1982 to present, to calculate sea surface temperature (SST) anomalies, long-term trends, seasonal cycles, and marine heatwave statistics. OISST provides a consistent multi-decadal record suitable for long-term trend analysis and allows direct comparison with prior GMRI warming reports.
GLORYS12v1 Ocean Reanalysis
To improve spatial detail and extend the analysis to subsurface conditions, we use the GLORYS12v1 global ocean reanalysis (1/12° horizontal resolution, 50 vertical levels) for the period 1993-2025 (the satellite altimetry era). GLORYS12v1 assimilates satellite and in situ observations into a dynamical ocean model, providing three-dimensional temperature fields.
European Centre for Medium-Range Weather Forecasts’ Fifth Reanalysis
To calculate the net air-sea heat flux, we used the European Centre for Medium-Range Weather Forecasts’ Fifth Reanalysis (0.25 spatial resolution) from 1991-2025. Surface net solar radiation, surface net thermal radiation, surface sensible heat flux, and surface latent heat flux were used to calculate the net-air sea heat flux and cumulative heat input.
Climatology and Baseline Periods
Temperature anomalies are calculated relative to fixed baseline climatologies: 1991 – 2020 for NOAA OISST (to maintain consistency with previous GMRI warming reports and other NOAA climate assessments); 1993 – 2020 for GLORYS12v1 (to ensure internal consistency within the altimetry-era reanalysis record). Daily climatologies were constructed using a smoothed seasonal cycle derived from multi-year daily means, ensuring comparability with marine heatwave detection thresholds. The daily net air-sea heat flux climatology was also calculated using a 1991 – 2020 baseline and smoothed.
Marine Heatwave and Cold Spell Definition
Marine heatwave and cold spell events were identified following the framework of Hobday et al. (2016) and Oliver et al. (2018). Events were defined as periods during which daily SST: exceeded the smoothed 90th percentile (MHW) or fell below the smoothed 10th percentile (cold spell), for at least five consecutive days. Gaps of up to two days below (or above) the threshold were merged into a single event. Event characteristics, including start date, end date, duration, and peak intensity, were derived directly from the daily SST time series. Bottom temperature events were evaluated using the same percentile-based framework, applied to GLORYS-derived bottom temperature time series.
Regional Delineation
Unlike earlier GMRI warming reports that defined the Gulf of Maine using a rectangular “box” region extending partially into slope waters, this report uses a precisely delineated Gulf of Maine Ecological Production Unit (EPU) boundary as defined by NOAA. The EPU boundary more closely represents shelf waters that define the Gulf’s physical and ecological system. The previous “box” approach incorporated portions of the adjacent slope ocean, where temperature variability and warming rates can differ due to Gulf Stream and slope water influences. As a result, mean temperatures, anomaly magnitudes, and trend estimates may differ modestly from prior reports, reflecting the improved geographic precision rather than a change in underlying climate signals.
Overall, the updated boundary improves ecological relevance, spatial consistency, and alignment with fisheries and ecosystem assessments that are structured around the EPU framework.
Reproducibility
All datasets used in this report are publicly available. Analyses were conducted using standard statistical methods for anomaly calculation, linear trend estimation, percentile threshold detection, and spatial averaging. The use of fixed climatological baselines ensures consistency across figures and comparability with prior GMRI warming assessments.
Recommended Citation
Gulf of Maine Research Institute, 2026. 2025 Gulf of Maine Warming Update. https://gmri.org/stories/temperature-2025
Author Contributions
The report was led and written by Dr. Zhuomin (Jasmine) Chen.
Katie Giannakopoulos contributed analysis and writing for the atmospheric dynamics section.


