2024 Casco Bay Ecosystem Monitoring Report
Reports | Feb 11, 2025
Over the last several decades, we've seen dramatic ecosystem changes in the Gulf of Maine. We've observed population spikes and declines, habitat loss and recovery, and the appearance of new species that typically occur in regions to our south.
We are conducting long-term, nearshore monitoring to learn about the pace and direction of these changes in our region. Read on to dive into our key findings.

Report Highlights
- Our ten most commonly caught species while beach seining were green crab, Atlantic silverside, mummichog, winter flounder, Atlantic herring, alewife, Atlantic tomcod, bluefish, grubby sculpin, and northern pipefish.
- This year we caught fallfish, Atlantic saury, and Atlantic moonfish for the first time.
- The increasing presence of white mullet suggests that some historically southern species may be establishing a more permanent presence in Casco Bay.
- Our survey data show notable trends in species abundance. Atlantic tomcod, a cold-adapted species, was more abundant than ever, with its numbers linked to shifts in seasonal temperatures and precipitation.
- Juvenile pollock catches surged in 2024, aligning with recent increases in Gulf of Maine pollock recruitment.
- Fishermen and harvesters noted unusual patterns this year. Lobster landings were inconsistent, blue crabs appeared in greater numbers in the New Meadows estuary, and tunicates (sea squirts) caused widespread fouling issues for lobstermen and aquaculture growers.
- Moderate drought conditions and a lack of late-season storms led to unusually stratified nearshore waters, potentially impacting fish behavior and ecosystem dynamics.
The Importance of Near-shore Ecosystem Monitoring
Casco Bay holds a rich cultural, economic, and ecological significance for our region. It is home to Portland, and includes over 200 islands (many of which are inhabited year-round by generations of Maine fishing families). The region is integral to Maine's identity as a hub for lobster fishing and contributes to the state's cultural image and traditions. In addition to supporting multiple fisheries and a growing aquaculture industry (shellfish and seaweed), Casco Bay serves as prime location for tourism and recreational activities.
Casco Bay is a vital marine and coastal habitat within the Gulf of Maine, one of the world’s most productive marine ecosystems. Its tidal marshes, estuaries, and rocky shores support diverse marine life, while its wetlands and eelgrass beds contribute to carbon sequestration and nutrient cycling. The bay also acts as a natural buffer, protecting the coastline against storms and erosion.
The Gulf of Maine is warming faster than most of the world's oceans, driving major fishery changes, including a northern shrimp moratorium, cod stock declines, and shifting species distributions that disrupt ecosystems. While remote observation methods track physical and some biological changes — such as temperature and chlorophyll levels via NASA satellites and buoy instruments — assessing higher trophic levels like fish relies on trawl surveys and fisheries landings, which focus offshore. Nearshore environments like Casco Bay remain largely unmonitored, leaving critical knowledge gaps about ecosystem shifts. Our nearshore monitoring efforts are essential to filling these gaps.
The Casco Bay Aquatic Systems Survey
The Casco Bay Aquatic Systems Survey (CBASS) is a long-term nearshore monitoring program we designed to fill this gap. Since 2014 we have been conducting a suite of on-the-water monitoring activities specifically designed to document, quantify, and predict ongoing and future ecological changes in the bay.
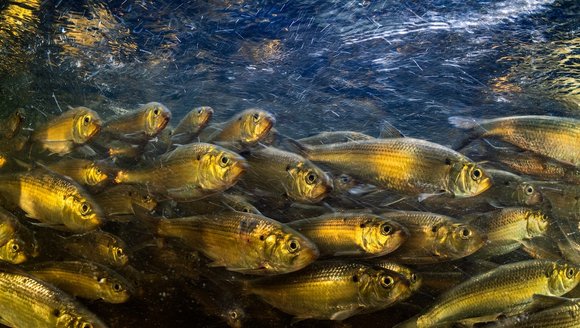
We monitor river herring runs in the Presumpscot River, conduct beach seine surveys (for juvenile and nearshore fish) in the western half of the bay from the mouth of the Presumpscot to beyond Portland Head Light, and hook-and-line surveys (for groundfish) in the outer portion of the bay out to the West Cod ledges (~2 – 5 miles offshore). Starting in 2023 we added beach seining to the eastern end of the bay in collaboration with the Quahog Bay Conservancy. Since 2017 we have also been conducting surveys designed to understand changes in mussel populations in the bay.

Our beach seine data helps track changes in the abundance and habitat use of common nearshore species like juvenile Atlantic herring, alewife, sand lance, silverside, mummichog, and winter flounder — within swimming distance from shore. Length measurements, combined with temperature data, reveal how warming waters may impact growth rates.
Hook-and-line data provides insight into groundfish populations in rarely surveyed habitats, such as shallow, nearshore ledge areas. This helps us assess shifts in groundfish communities and how certain species may be pre-adapted to warming.
Finally, our monitoring efforts allow us to track the arrival of southern species that may represent the leading edge of a species reorganization in southern Maine waters, which could have unknown ecological consequences. While not part of our formal monitoring activities, we also have close contacts in the fishing industry who observe ecosystem conditions on a daily basis.
Species of Note
Beach seine results indicated that the Casco Bay nearshore fish community assemblage in 2024 was similar to the previous ten years of results. Our ten most commonly caught species were:
- Green crab (Carcinus maenas)
- Atlantic silverside (Menidia menidia)
- Mummichog (Fundulus heteroclitus)
- Winter flounder (Plueronectes americanus)
- Atlantic herring (Clupea harengus)
- Alewife (Alosa pseudoharengus)
- Atlantic tomcod (Microgadus tomcod)
- Bluefish (Pomatomus saltatrix)
- Grubby sculpin (Myoxocephalus aenaeus)
- Northern pipefish (Syngnathus fuscus)

We caught three new species in 2024: fallfish (Semotilus corporalis), Atlantic saury (Scomberesox saurus), and Atlantic moonfish (Selene setapinnis). We caught fallfish, a large freshwater minnow species native to New England, in the fresher reaches of the Presumpscot River. Atlantic saury are native across most of the North Atlantic region, with an estimated distribution stretching from North Carolina to the Gulf of Saint Lawrence along the North American coast. They are highly migratory. Though we had not caught one before September 2024, they are known to move inshore during the summer and may form large shoals. Atlantic moonfish are native to coastal tropical and subtropical regions in the Western Atlantic and are seldom seen north of Cape Cod. We caught a juvenile moonfish in early October 2024, which indicates that it was likely entrained in the Gulf Stream current and advected far north of the spawning ground from which it originated.
Southern Species
We have noted an increasing presence of “southern species” in recent years of our survey efforts. Some of these species, like moonfish, are often called “Gulf Stream Orphans.” These tropical or subtropical fish are not adapted to the cold winters of the Northern Atlantic, and will not survive when water temperatures decline past their thermal tolerances. Other orphans we have caught include crevalle jack (Caranx hippos) and permit (Trachinotus falcatus). Some “southern species,” like summer flounder (Paralichthys dentatus) and white mullet (Mugil curema), are native to regions south of Cape Cod but may have small populations that seasonally occur in Casco Bay. In particular, we have noted persistent and increasing presence of white mullet since 2022, which may indicate year-round colonization as winter water temperatures have increased.

Emergent Trends
Beach Seine Survey
While we didn’t observe dramatic shifts in nearshore fish communities, unusual weather and decreased heat likely influenced the abundance of common Casco Bay species. Notably, we captured more Atlantic tomcod—locally known as frostfish—than in any previous survey year.
Tomcod spawn in freshwater reaches of estuarine rivers from November to February, and juveniles will migrate downstream to the nearshore marine ecosystem by June. Typically, peak catches occur in late June, with few observed after mid-July. Their sensitivity to summer temperatures and winter precipitation makes them a useful indicator of climate-linked ecosystem change.
Our models identified key factors affecting tomcod abundance: average daily temperature from July to September, total precipitation from January to March, and total snowfall in April — all significantly influenced catch variability across years.

Seine samples indicate that estuarine residents like Atlantic silverside spawned later in 2024 than in 2023, aligning with fishermen’s observations of delayed ecosystem processes (see On the Water for details).
A collaborative study between GMRI scientists and QBC interns examined how summer water temperatures affect the growth rates of Atlantic silverside (a warm-adapted estuarine resident) and Atlantic herring (a cold-adapted migrant). By tracking the youngest cohort of each species, researchers calculated weekly growth rates in “warmer” and “cooler” summers.
Herring grew an average of 2.5 mm per week—higher than the previous two years (1.3 – 1.4 mm per week) but consistent with expectations for a warmer summer. Silverside grew just 2.5 mm per week, the second-lowest rate recorded. In past “warmer” summers, they grew 4.5 – 6.2 mm per week, and in “cooler” summers, 2.3 – 3.9 mm. Cooler spring temperatures likely delayed spawning, slowing silverside growth in our observation period.

Jigging Survey
We conduct jigging surveys to explore life history variation in two important groundfish in Casco Bay: Atlantic cod (Gadus morhua) and Atlantic pollock (Pollachius virens). Pollock caught in our jig survey demonstrate color variation (below). We are investigating if these color variations are the result of feeding strategies or if there are more substantial differences in populations, as Sherwood and Grabowski (2010) found. We hypothesize that certain life history variants are more tolerant of higher temperatures, and therefore better able to adapt to climate change. A more complete understanding of these life history adaptations will give us a more nuanced view of potential changes in food web dynamics in Casco Bay and other nearshore regions of the Gulf of Maine as waters warm.

Jig sampling for groundfish has been part of CBASS since its inception, though effort has varied due to funding. It was a core focus in 2014 – 2016 and again in 2023 – 2024.
We have 20 sites (ten were randomly selected and ten were chosen by GMRI staff) that we fish every two weeks throughout the summer for 20 minutes with two rods (with two hooks on each rod). One rod has clam strips for bait and one has artificial lures or flies.
We keep our methods consistent to make data easily comparable over the time span of sampling. In 2024, we completed five rounds of sampling over ten weeks for a total of 100 sites fished for the year. All fish are measured and released, except for the cod and pollock, which are photographed for color analysis and brought back to our lab for dissection and further analysis.
In 2024, we primarily caught pollock (180), cod (60), and Atlantic mackerel (Scomber scombrus; 60). Across years, our catch per unit effort (fish/hour) varies across species, with pollock dramatically increasing in 2024. This surge in juvenile pollock catches may be related to the statistically significant increase in pollock recruitment in recent years (Mills et al., 2024).
We will process all pollock and cod we caught this winter (2024 – 25) to add to our data set that includes samples from 2014, 2015, 2016, 2017, and 2023. These data will be used for color, diet, age, growth, spawning, and morphometric analyses to test our hypotheses.

On the Water
Summer 2024 saw a return of elevated temperatures following a cooler-than-average spring. However, while Gulf of Maine SST data reflected warming, many lobstermen and fishermen reported nearshore waters closer to normal. Lobster fishing was inconsistent, with fluctuating catches, though the Maine Lobster Community Alliance called the season a “reasonable success” (Landings, January 2025).
Pogies (Atlantic menhaden; Brevoortia tyrannus) appeared less abundant around Casco Bay, and striped bass catches were marginal, reflecting stock declines. Mackerel were plentiful, as confirmed by our jigging data, and Atlantic bluefin tuna (Thunnus thynnus) remained abundant in the outer parts of Casco Bay most of the summer, although the market for them remained weak.
We experienced moderate drought conditions throughout most of the summer and fall, reducing freshwater discharge into Casco Bay this year. The region also saw minimal effects from post-tropical storms in the late summer or fall of 2024, further exacerbating drought conditions and contributing to stratification of nearshore waters.
Fishermen observed American plaice (Hippoglossoides platessoides) and winter flounder moving closer to shore, likely due to water temperatures and prey availability, though low ex-vessel prices remain a challenge. Quahog (hard-shell clam; Mercenaria mercenaria) harvesters in the New Meadows Lake reported increasing blue crab (Callinectes sapidus) numbers, raising concerns about impacts on quahog populations.
Tunicates caused significant biofouling on fishing gear, creating issues for both lobstermen and aquaculture farmers.


Insights and Commentary
The Gulf of Maine has recently experienced an influx of the coldest bottom waters since 2012, likely due to Labrador Slope Water from the north (Record et al. 2024). This shift, first noted in fall 2023, may have reached surface waters through vertical mixing from seasonal cooling and storms.
Beyond temperature, 2024 saw notable meteorological events. Portland International Jetport recorded one of the top five wettest first quarters (January – March) on record, with several storms bringing heavy rain, high winds, and coastal flooding.
Despite ongoing warming trends, the NOAA Portland Harbor tide gauge recorded the coldest average surface water temperature since 2020. While still anomalously high compared to the 2003–2020 climate reference period, this slight cooling may have influenced the nearshore Casco Bay ecosystem.
Looking ahead
Beyond seining and jigging to sample nearshore fish populations, GMRI and QBC scientists also collect surface water samples to detect fish species via the presence of environmental DNA (eDNA). Fish leave traces of DNA in the environment through sloughing of cells, excretion of bodily fluids, or release of gametes. By filtering water samples through specialized equipment, we can extract these traces of DNA. We then use highly-sensitive molecular approaches like quantitative polymerase chain reactions (qPCR) to detect and quantify the presence of eDNA that matches a sequence belonging to target species. We recently opened a molecular lab within GMRI and are processing water samples collected over the previous few years.
Preliminary results indicate that not only can we detect Atlantic herring eDNA, but our detected herring eDNA signals match the known temporal trends of herring presence in nearshore Casco Bay. We look forward to processing our collection of water samples for other species of interest in the hopes of assessing the relationship between seine catches and eDNA presence.
-
Casco Bay Ecosystem Monitoring Reports
Explore our previous ecosystem reports.
-
![This is a graphic with paper cut style colored squares scattered across the image.]() 2023 Casco Bay Ecosystem Monitoring Report
2023 Casco Bay Ecosystem Monitoring Report
About These Reports
We began collecting field data in 2014 as part of a long-term, nearshore ecosystem monitoring effort in the Gulf of Maine. For 10+ years, this monitoring has provided us with insights about complex, nearshore ecosystem changes. It also provides a baseline for context and comparison in the future. Continuously collecting samples in (and adjacent to) the bay over time enables us to detect, understand, project, and communicate change.
These reports highlight key trends from our observations and offer context on the impact of ocean warming on critical components of the Gulf of Maine ecosystem, with a particular emphasis on Casco Bay.

About Casco Bay
Casco Bay (Figure 6) is a semi-enclosed bay located within the broader Gulf of Maine. This relatively shallow body of water covers approximately 230 square miles, and 578 miles of coastline.
Physical factors generate high productivity in Casco Bay and the Gulf of Maine. First, two key oceanographic currents, the cold Labrador Current and the warm Gulf Stream, meet just offshore. They mix nutrients, algae, and plankton that are then available to fish, seabirds, and marine mammals to eat. Second, these systems have a complex bottom topography created from glacial scour at the last Ice Age (20,000 years ago). The topography includes deep trenches, shallow banks, and prominent ridges. These features provide critical habitat for the region’s diversity of invertebrates, fish, and mammals.